雅思小作文柱状图怎么写?柱状图是由横、纵坐标轴及长度不等的柱状体组合而成的。柱状图一般用来表示同一项目在不同时间里的,或者是同类项目在不同时间里的对比关系。一般来说,横轴表示时间,或者用来区分不同的种类;纵轴则表示具体的量。柱状图由若干柱状体按照类别和时间有序排列而成。柱状体常用不同的灰度、点、线、文字加以区分。广州朗阁雅思资深老师认为,在分析柱状图的时候,不仅要辨清横轴和纵轴的含义和所标数据,更要分析柱状体之间的相互关系。柱状图数字之间的对比非常明显。写作时的描述顺序可按照柱状体的分组依次进行,也可按照组与组之间的内在联系作纵向比较和分析。在比较数据时,务必留意差别较大的典型的同类数据;还耍注意对不同类别的数据进行分析和归类。就让广州朗阁雅思资深老师告诉你:雅思小作文柱状图怎么写?
广州朗阁雅思资深老师认为柱状图作文的写作要点:
轴分纵横,各有其义;各柱关系,务求分清;同类相比,着眼极值。
·注意不同颜色的柱状体所代表的不同类型。
·注意柱与柱之间的比较。
·注意分段说明,一段从一个角度来比较和对比。
·注意比较柱与柱之间的差别,突出描写典型的差别。
The graph below shows the different modes of transport used to travel to and from work in one European city in 1950, 1970 and 1990.
Write a report describing the information shown below.
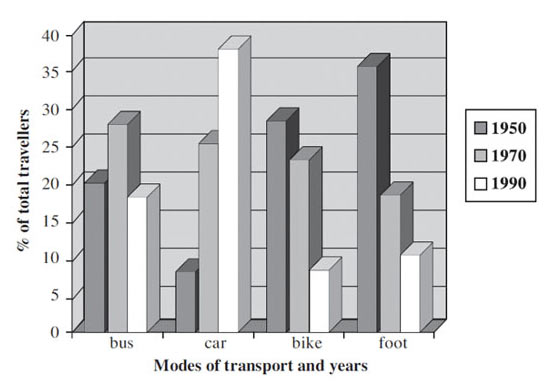
A comparative study of modes of transport used by city dwellers in a European city shows us a steady decrease in transportation by bicycle and on foot from 1950 to 1990, while there was a significant increase by bus and by car. [点题并作总体说明]
In 1950 more than 50%of the people travelled to work on their own. However,by 1990, less than 20%of the travellers were cycling or walking to work. During the same period, there was a large increase in the use of automobiles. In 1950, very few people drove cars to work. By 1970,approximately one out of every four travellers began to use cars to work. This increase continued, and by 1990, one out of three travellers chose todrive to and from work. [按时间顺序分类描写,并对比典型数据]
The percentage of people taking the bus increased from 1950 to 1970 (from 20%to 28%),but by 1990 it decreased to even a little bit less than what it was in 1950. And travelling by car had become so popular that other means of transport were less frequently used. [作总结]
与“雅思小作文柱状图怎么写”相关文章
赞(0)
12
12
分享:
